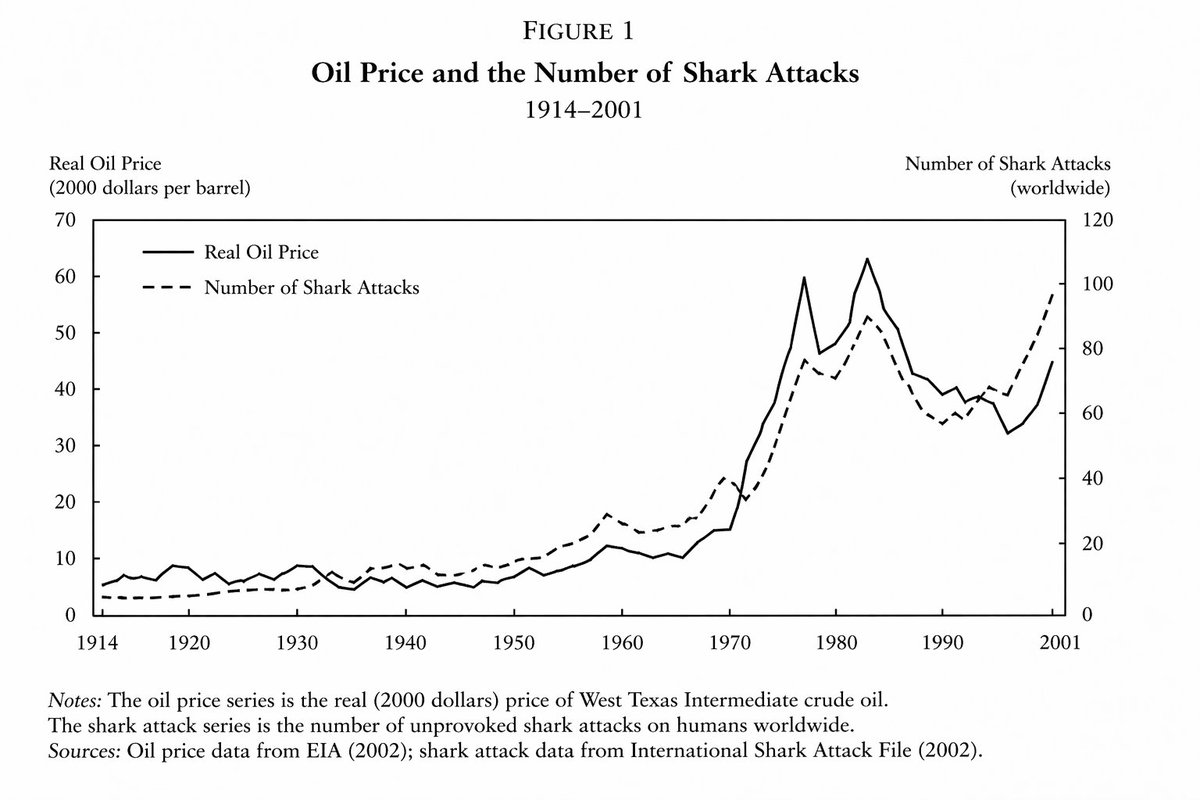
line graph from an important and prestigious [field] demonstrating a close but not exact relationship between [variable one] and [variable two] between [time period]
💡 About This Prompt
A prompt designed to generate highly realistic but fictitious academic charts, specifically showing a correlation between oil prices and shark attacks in an economics paper style.


0 Comments
👥 Co-learning Circle 0
Observe other members' variables & configurations, and click "Study & Retry" to instantly import settings and practice!